


The Council of State Governments Justice Center (CSG Justice Center) and the Vermont Department of Corrections (Vermont DOC) have launched the Vermont Corrections Dashboard, an innovative template for quarterly reports to summarize key data for the corrections agency, including change in corrections populations, recidivism indicators, and average length of stay. The dashboard now allows the Vermont DOC to easily view a wide variety of statistics, observe trends, and assess progress toward agency and/or legislative goals.
“The dashboard is a useful tool for highlighting the broad issues impacting the Department,” says Monica Weeber, Vermont DOC Director of Planning. “It displays key metrics in a meaningful context that allows the reader to instantly understand the significance of the information. Concepts that have previously been displayed on multiple documents can now be viewed on one easy-to-understand report.”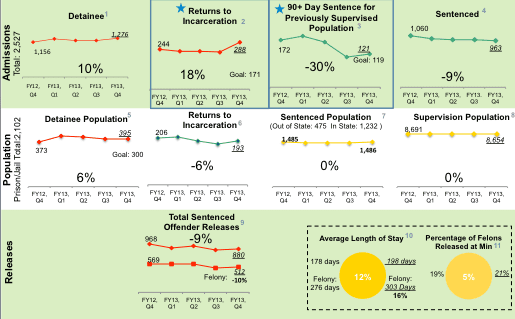
The project began in early 2012 with conversations between State Senator Richard Sears and CSG Justice Center Director Michael Thompson about ways the state could more efficiently monitor and share information about the population in its corrections system. The two came up with the concept of a data dashboard, and the CSG Justice Center’s Research Division conducted a series of meetings with the Vermont DOC and the Vermont Joint Legislative Corrections Oversight Committee about data collected by the state and the trends stakeholders were interested in tracking. The Research Division developed measures, determining how to draw the most information from what the state was already collecting, and designed the dashboard with input from the Corrections Oversight Committee.
The dashboard is a two-page quarterly snapshot of correctional and supervision populations, offender characteristics, and their movement in and out of the system. Each page presents different related sets of information through charts, graphics, and color coding. The first page shows data on population flow, such as admissions, population, and releases—fundamental information for any corrections department. Specific figures include number of admissions and population size, number of returns to incarceration, number of individuals sentenced, and number of individuals under supervision.
A unique feature of the dashboard report is its presentation of relationships and trends in data. For each measure, the dashboard provides a line graph and three figures: the number for the most recent quarter, the number for that quarter one year prior, and the percent change between the two. For example, the dashboard reveals that in the fourth quarter of FY 2013, 193 individuals among the prison and jail populations were formerly incarcerated, compared to 206 people in the fourth quarter of FY 2012—a 6-percent decline.
The Vermont DOC now maintains the dashboard, while the CSG Justice Center provides ongoing support in interpreting trends and implications for policy change.
“Local governments are undergoing a revolution in how they approach data management and database structures,” said Jessica Tyler, Research Manager at the CSG Justice Center. “This dashboard allows the state to hone the data it wants and needs to collect in order to explain the flow through the criminal justice system.”


 This Giving Tuesday, Help Us Break the Cycle of Incarceration, Uphold Justice, and Offer Second Chances
Read More
This Giving Tuesday, Help Us Break the Cycle of Incarceration, Uphold Justice, and Offer Second Chances
Read More

 Vermont Executive Working Group Hears Recommendations on How to Improve Domestic Violence Responses
Read More
Vermont Executive Working Group Hears Recommendations on How to Improve Domestic Violence Responses
Read More
 Minnesota Department of Health Leads Cross-County Collaboration to Support Families Impacted by Incarceration
s one of the first points of contact in the criminal justice…
Read More