


Conservative estimates show that rates of COVID-19 cases among people incarcerated in state prisons and prison staff are more than three-and-a-half times higher than that of the general public, according to a new analysis by The Council of State Governments (CSG) Justice Center.
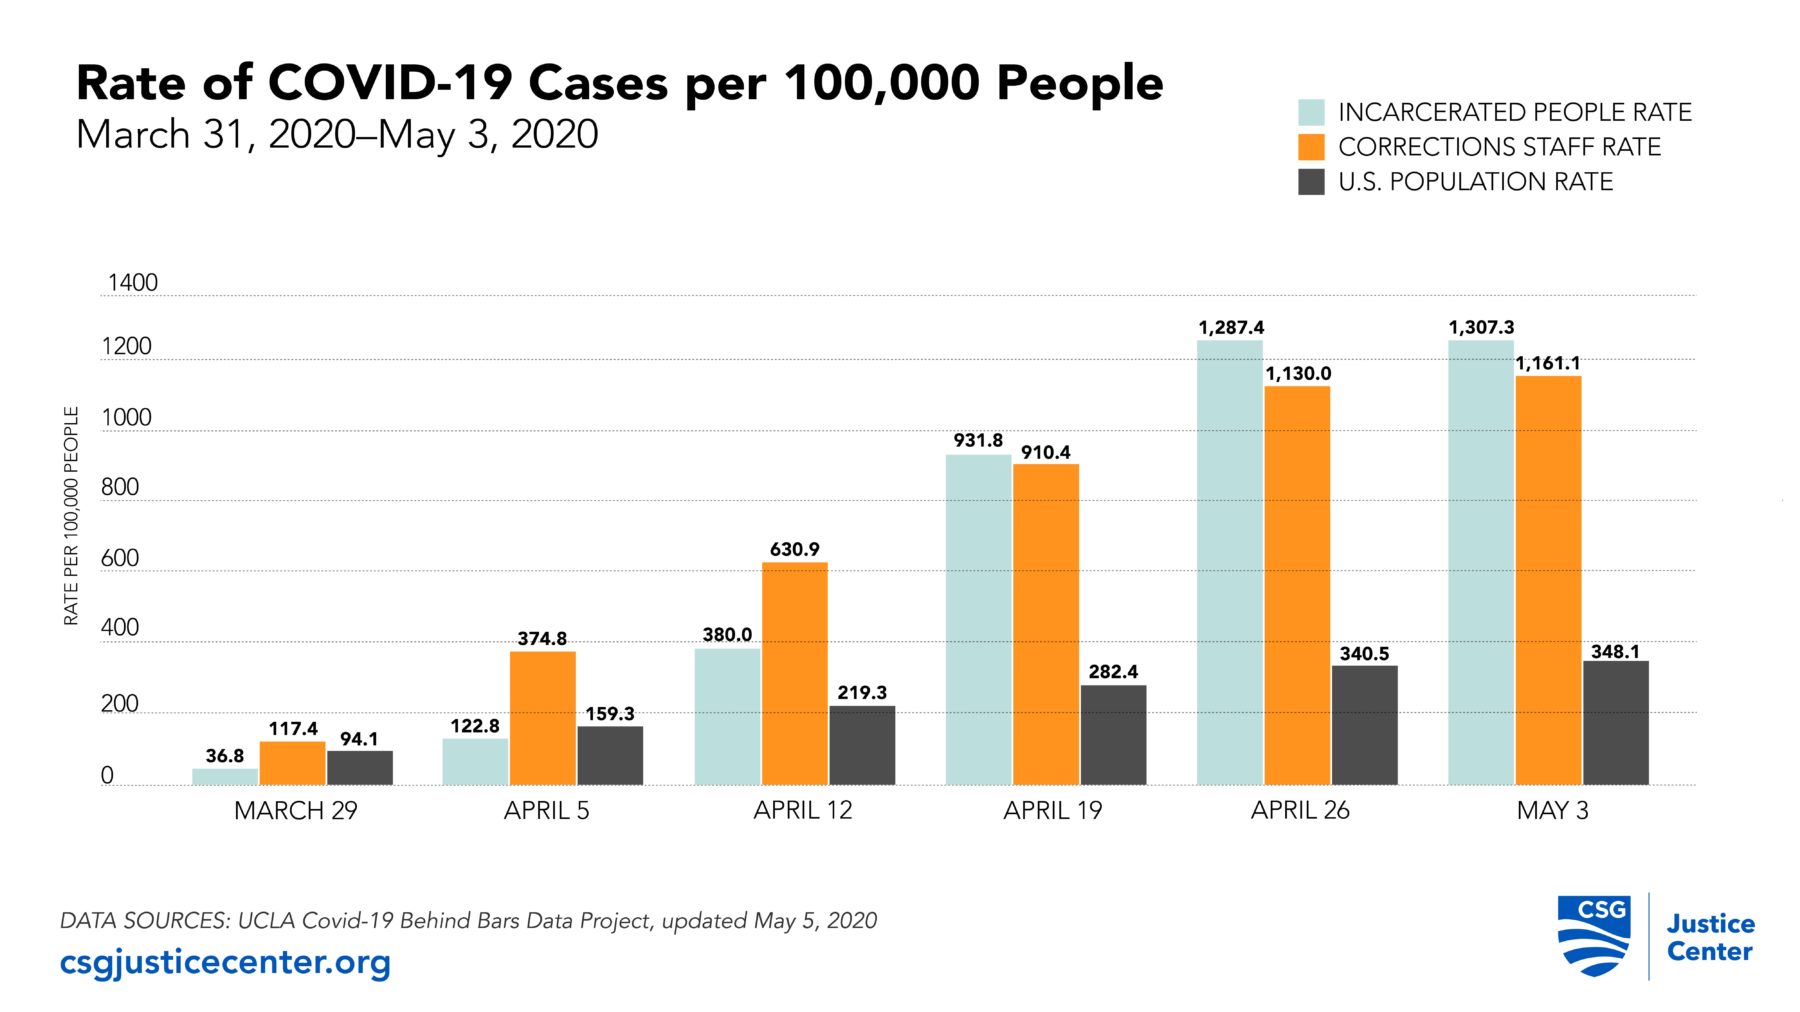
As of May 3, coronavirus cases among people currently incarcerated in state prisons were more than 3.75 times higher than the rate of the general population, while cases involving corrections staff were 3.33 times higher than cases in the general population.
The rate of confirmed infections among incarcerated people and prison staff was similar to that of the general population early in the pandemic, but then began to outpace the rest of the country quickly. Prison staff started testing positive at a higher rate in the first week of April before a large jump in confirmed positive cases among people incarcerated in prisons, which started to grow more rapidly the following week.
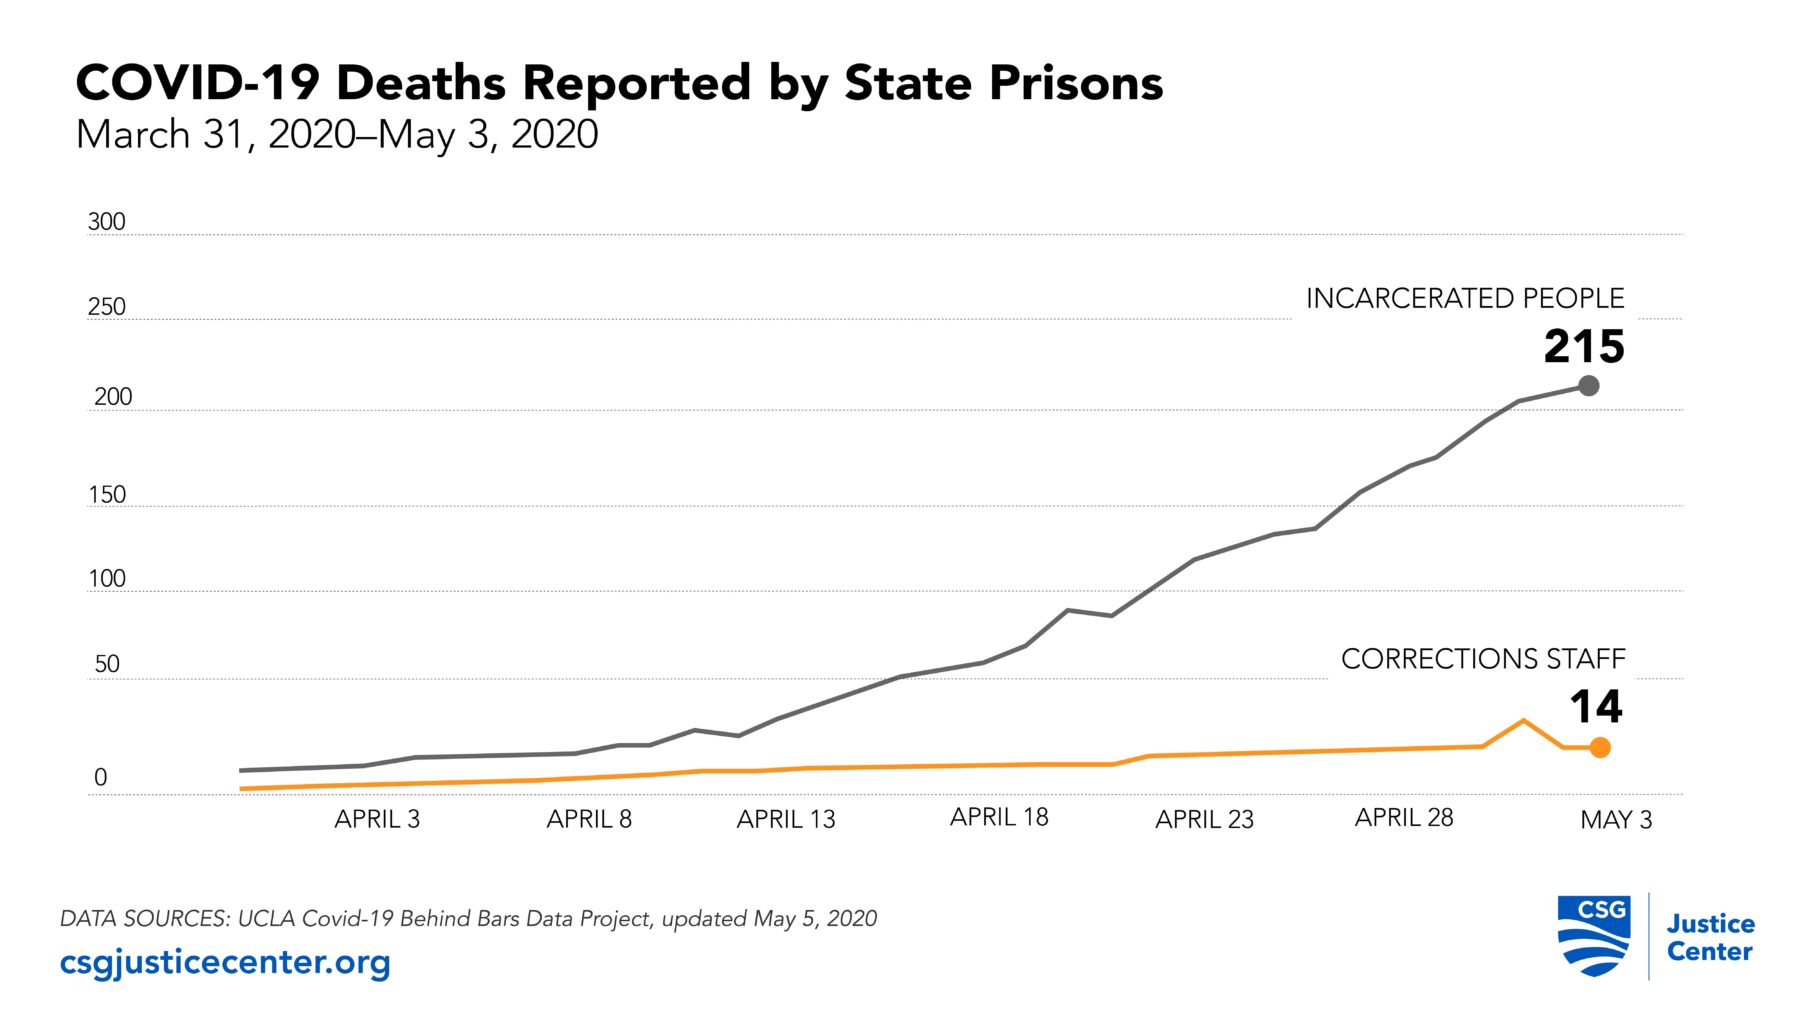
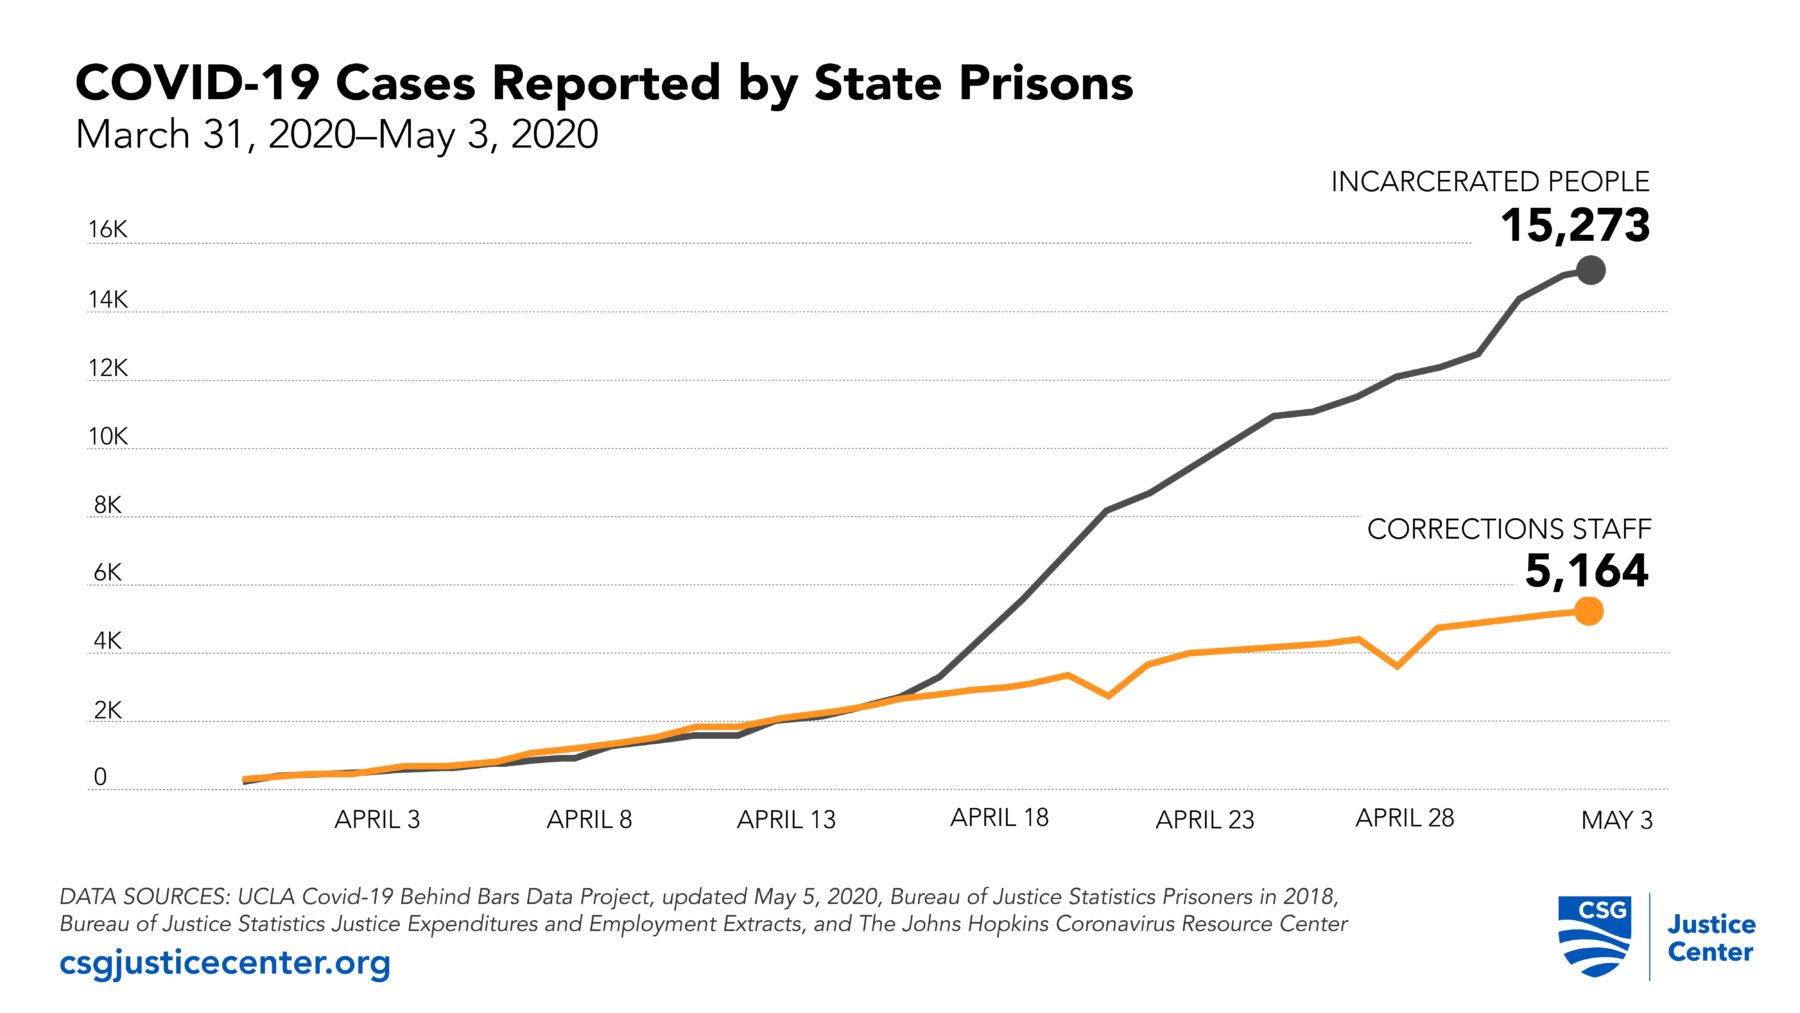
These disproportionate rates are part of a surge in cases and deaths reported by corrections officials over the last month. The number of positive COVID-19 cases was 27 times higher on May 3 than on April 3, and the number of confirmed deaths was 46 times higher on May 3 than a month prior.
Data show that the number of confirmed COVID-19 cases and deaths among people in prison and staff members was generally equivalent through mid-April, at which point they diverged, and cases increased within the incarcerated population more quickly. As of May 3, there were three times more confirmed cases of the virus among the incarcerated population than the staff population and 15 times more deaths.
The coronavirus analysis released Wednesday is part of an ongoing effort by the CSG Justice Center to analyze these data, identify trends, and develop tools to help states understand and respond to the virus in their prisons.
Data Collection Challenges
It is important to note that the CSG Justice Center cannot confirm the accuracy of the daily data being reported by prisons or determine whether it is complete. Comparisons of the data across additional sources show that the numbers generally align, but they are not identical. Small discrepancies also can be inflated when they are extrapolated to the population level.
“Most states do not release any type of real-time data on their facilities, so a framework for reporting on cases within their systems was virtually nonexistent before this crisis,” said Jessica Saunders, director of Research at the CSG Justice Center. “Many states are now releasing daily counts of confirmed cases and deaths at the state or institution level for their corrections staff and those who are incarcerated. This represents a new way of publicly releasing corrections data, which is a significant step forward in transparency.”
However, challenges with the data still exist. For instance, data tracked across states—as illustrated on the map in the image below—could also indicate differences in testing policies rather than true differences in infection rates.
Consistent and reliable data across all 50 states continues to be challenging to collect, and each individual effort tracking coronavirus cases and deaths uses slightly different figures. For example, The Marshall Project released data they collected from the states on both cases and populations, and The Covid Prison Project and The UCLA Covid-19 Behind Bars Data Project have teams of researchers, data scientists, and students collecting publicly available data from state corrections websites. Each uses a slightly different technique for collecting the data necessary to calculate rates of cases and deaths, as well as collecting the populations within the state prison systems necessary to calculate rates.
Methodology
Based on what we believe to be the most accurate and up-to-date numbers available, the CSG Justice Center is analyzing data from the following sources:*
- UCLA School of Law: Our analysis included UCLA data on the number of positive cases and deaths by day within state-run prisons. We then aggregated those numbers to the state level.
- The Marshall Project: We calculated rates within the resident population using data from The Marshall Project, which collected the population data directly from the states.
- The Justice Expenditure and Employment Extracts: To calculate rates within the corrections staff population, we used 2016 data from the Bureau of Justice Statistics to determine the total number of people employed by each state’s corrections administration, including full- and part-time employees.
- USA Facts: We also used data from USA Facts on daily COVID-19 cases and deaths by state to provide comparisons to the general population.
*These numbers differ slightly from the other sources.