


50 States, 1 Goal: Examining State-Level Recidivism Trends in the Second Chance Act Era
This report highlights the significant progress made in reducing recidivism across the country over the past 15 years. Since its passage in 2008, the Second Chance Act has invested in state and local efforts to improve outcomes for people leaving prison and jail, with a total of nearly 1,200 grantees from 48 states and 3 territories administering programs that have served more than 400,000 people.
Click to view an updated version of this report that reflects data up to 2022.
View an updated version of this report that reflects data up to 2022.
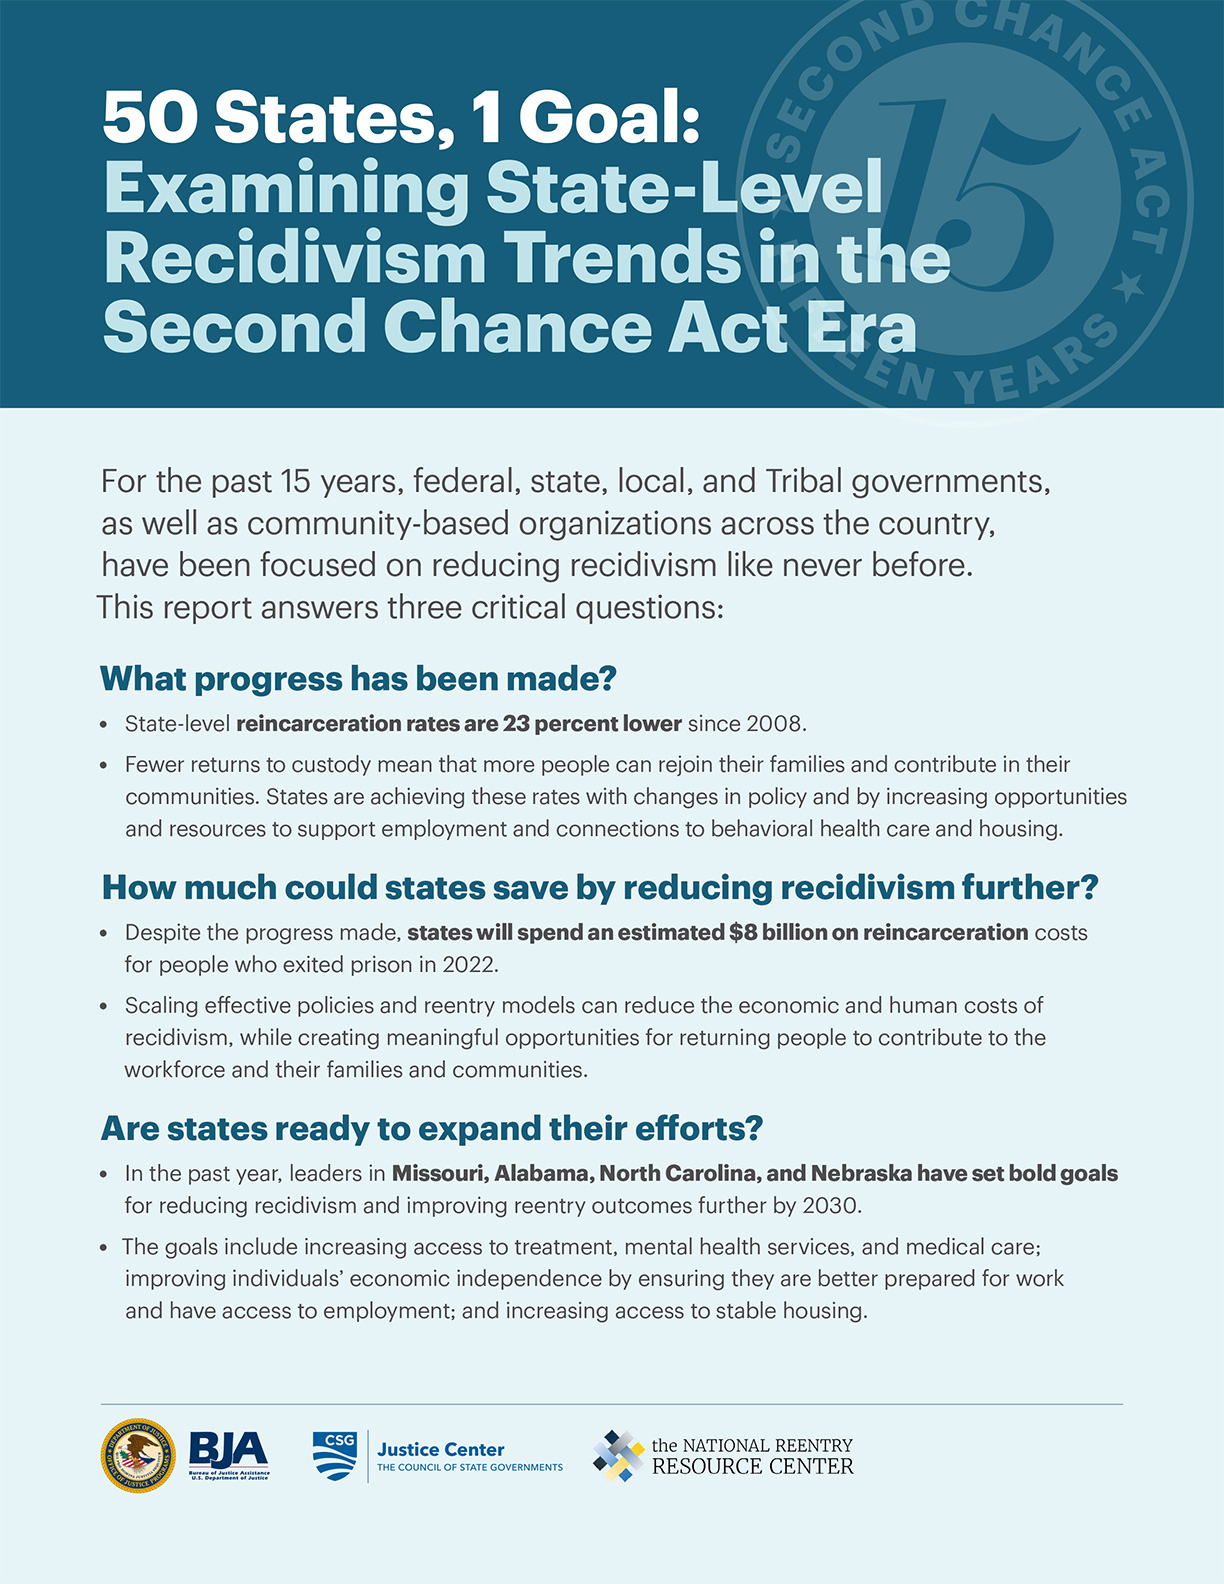
For the past 15 years, federal, state, local, and Tribal governments, as well as community-based organizations across the country, have been focused on reducing recidivism like never before. This report answers three critical questions:
What progress has been made?
- State-level reincarceration rates are 23 percent lower since 2008.
-
Fewer returns to custody mean that more people can rejoin their families and contribute in their communities. States are achieving these rates with changes in policy and by increasing opportunities and resources to support employment and connections to behavioral health care and housing.
How much could states save by reducing recidivism further?
- Despite the progress made, states will spend an estimated $8 billion on reincarceration costs for people who exited prison in 2022.
- Scaling effective policies and reentry models can reduce the economic and human costs of recidivism, while creating meaningful opportunities for returning people to contribute to the workforce and their families and communities.
Are states ready to expand their efforts?
- In the past year, leaders in Missouri, Alabama, North Carolina, and Nebraska have set bold goals for reducing recidivism and improving reentry outcomes further by 2030.
- The goals include increasing access to treatment, mental health services, and medical care; improving individuals’ economic independence by ensuring they are better prepared for work and have access to employment; and increasing access to stable housing.
Landmark Legislation Charts the Course
Since its passage in 2008, the Second Chance Act has invested $1.2 billion, infusing state and local efforts to improve outcomes for people leaving prison and jail with unprecedented resources and energy. Over the past 15 years, the Bureau of Justice Assistance and the Office of Juvenile Justice and Delinquency Prevention have awarded funding to 1,123 Second Chance Act grantees to improve reentry outcomes for individuals, families, and communities.1 And critically, the Second Chance Act-funded National Reentry Resource Center has built up a connective tissue across local, state, Tribal, and federal reentry initiatives, convening the many disparate actors who contribute to reentry success.
The result? A reentry landscape that would have been unrecognizable before the Second Chance Act’s passage. State and local correctional agencies across the country now enthusiastically agree that ensuring reentry success is core to their missions. And they are not alone: state agencies that work on everything from housing and mental health to education and transportation now agree that they too have a role to play in determining outcomes for people leaving prison or jail.
Community-based organizations, many led or staffed by people who were once justiceinvolved themselves, are contributing passion and creativity, standing up innovative programs to connect people with housing, jobs, education, treatment, and more. Researchers have built a rich body of evidence about what works to reduce criminal justice involvement and improve reentry outcomes, allowing the National Reentry Resource Center to create and disseminate toolkits and frameworks to support jurisdictions to scale up effective approaches. And private corporations that once saw criminal justice involvement as fatal to a candidate’s job application are now using their platforms to champion second chance employment as both a moral and business imperative.
The efforts of these key stakeholders are bigger, bolder, and better coordinated than ever, and they are producing results. Recidivism has declined significantly in states across the country, saving governments money, keeping neighborhoods safer, and allowing people to leave their justice involvement behind in favor of rich and meaningful lives in their communities.
States Report Lower Recidivism: By the Numbers
Measuring Recidivism
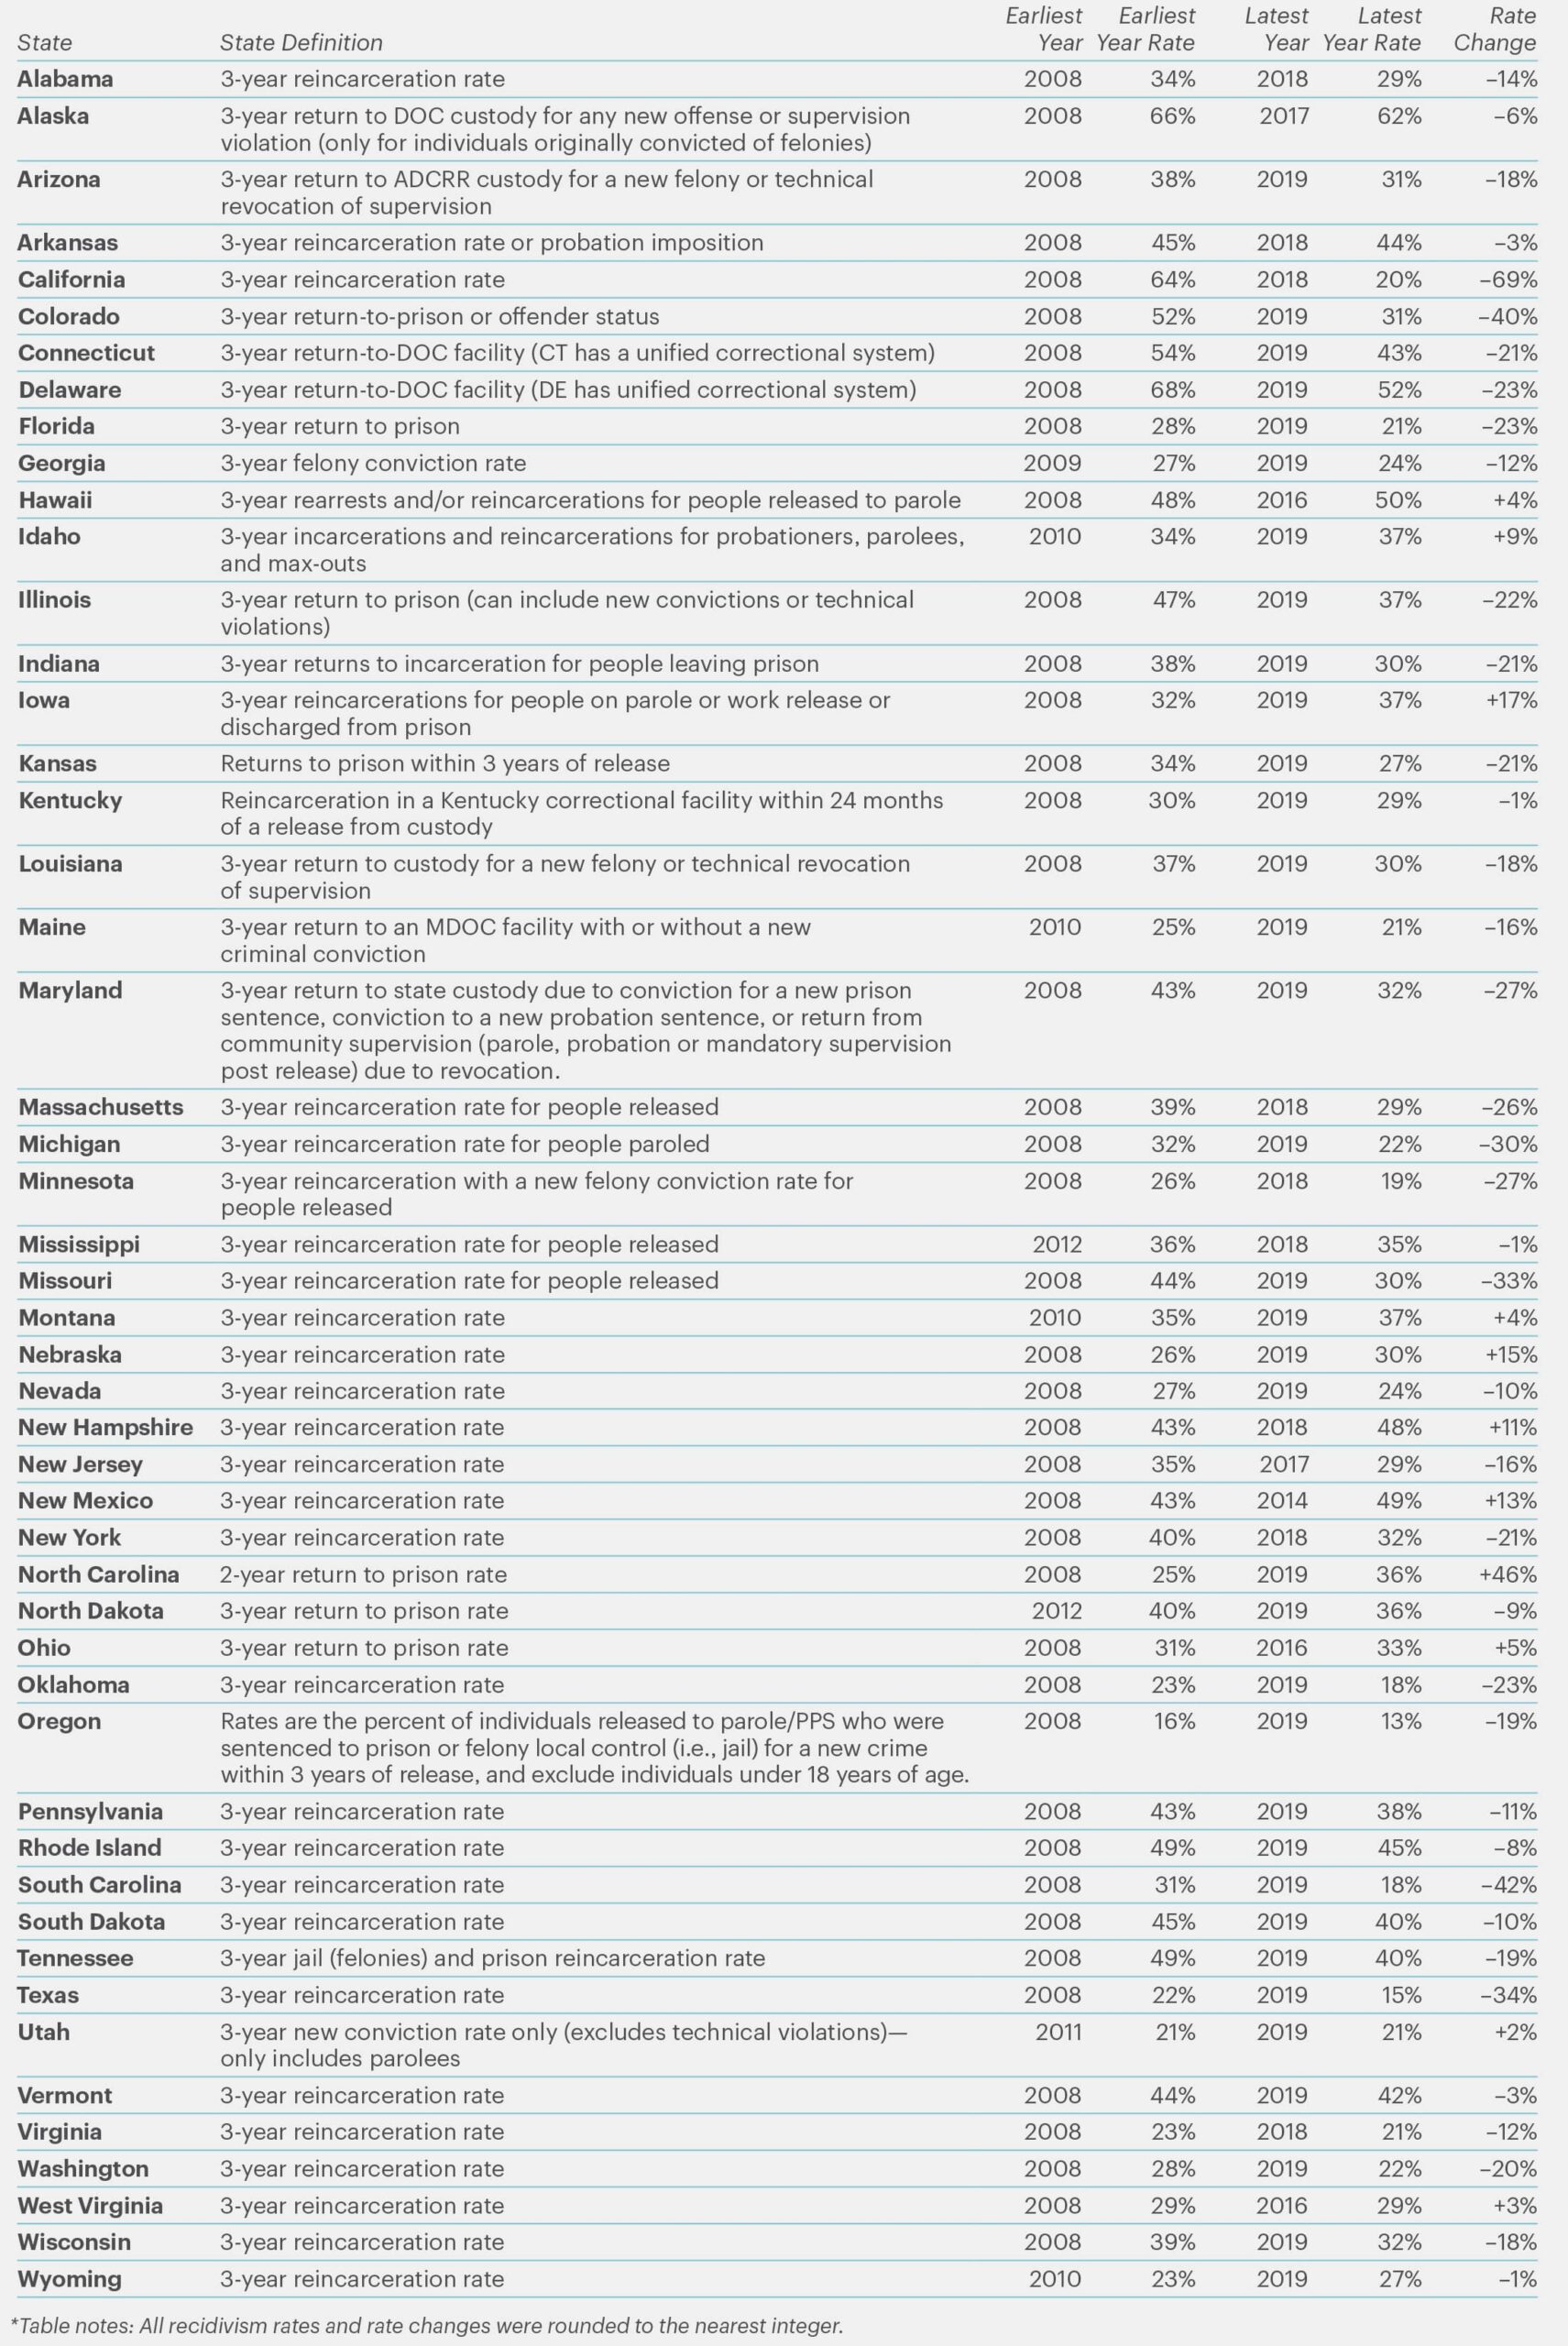
Recidivism can be measured in various ways, including rearrest, reconviction, reincarceration, and revocation from community supervision. This report looks at three-year reincarceration rates by release year, or the percentage of individuals released from state prison in a specific year who were reincarcerated in state prison within the next three years. This is the most commonly reported type of recidivism metric by states, allowing this report to include data from all 50 states. Variations in each state’s methodology for determining their reincarceration rate are noted in the methodology section at the end of this report.
Since the passage of the Second Chance Act in 2008, more and more state and local leaders have made recidivism reduction a public safety priority, pursuing a variety of strategies that are starting to show real results. The last available national estimate of recidivism was for a cohort of people released from prison in 2012.2 Data on recidivism of people exiting prisons and reentering communities more recently has been collected by the states, which have been tracking and reporting progress individually.
The Council of State Governments (CSG) Justice Center has collected and analyzed the most recent state-by-state data. (See State-by-State Recidivism Rates and Methodology Notes.) Our findings reveal that recidivism rates have dropped considerably in the past 15 years:
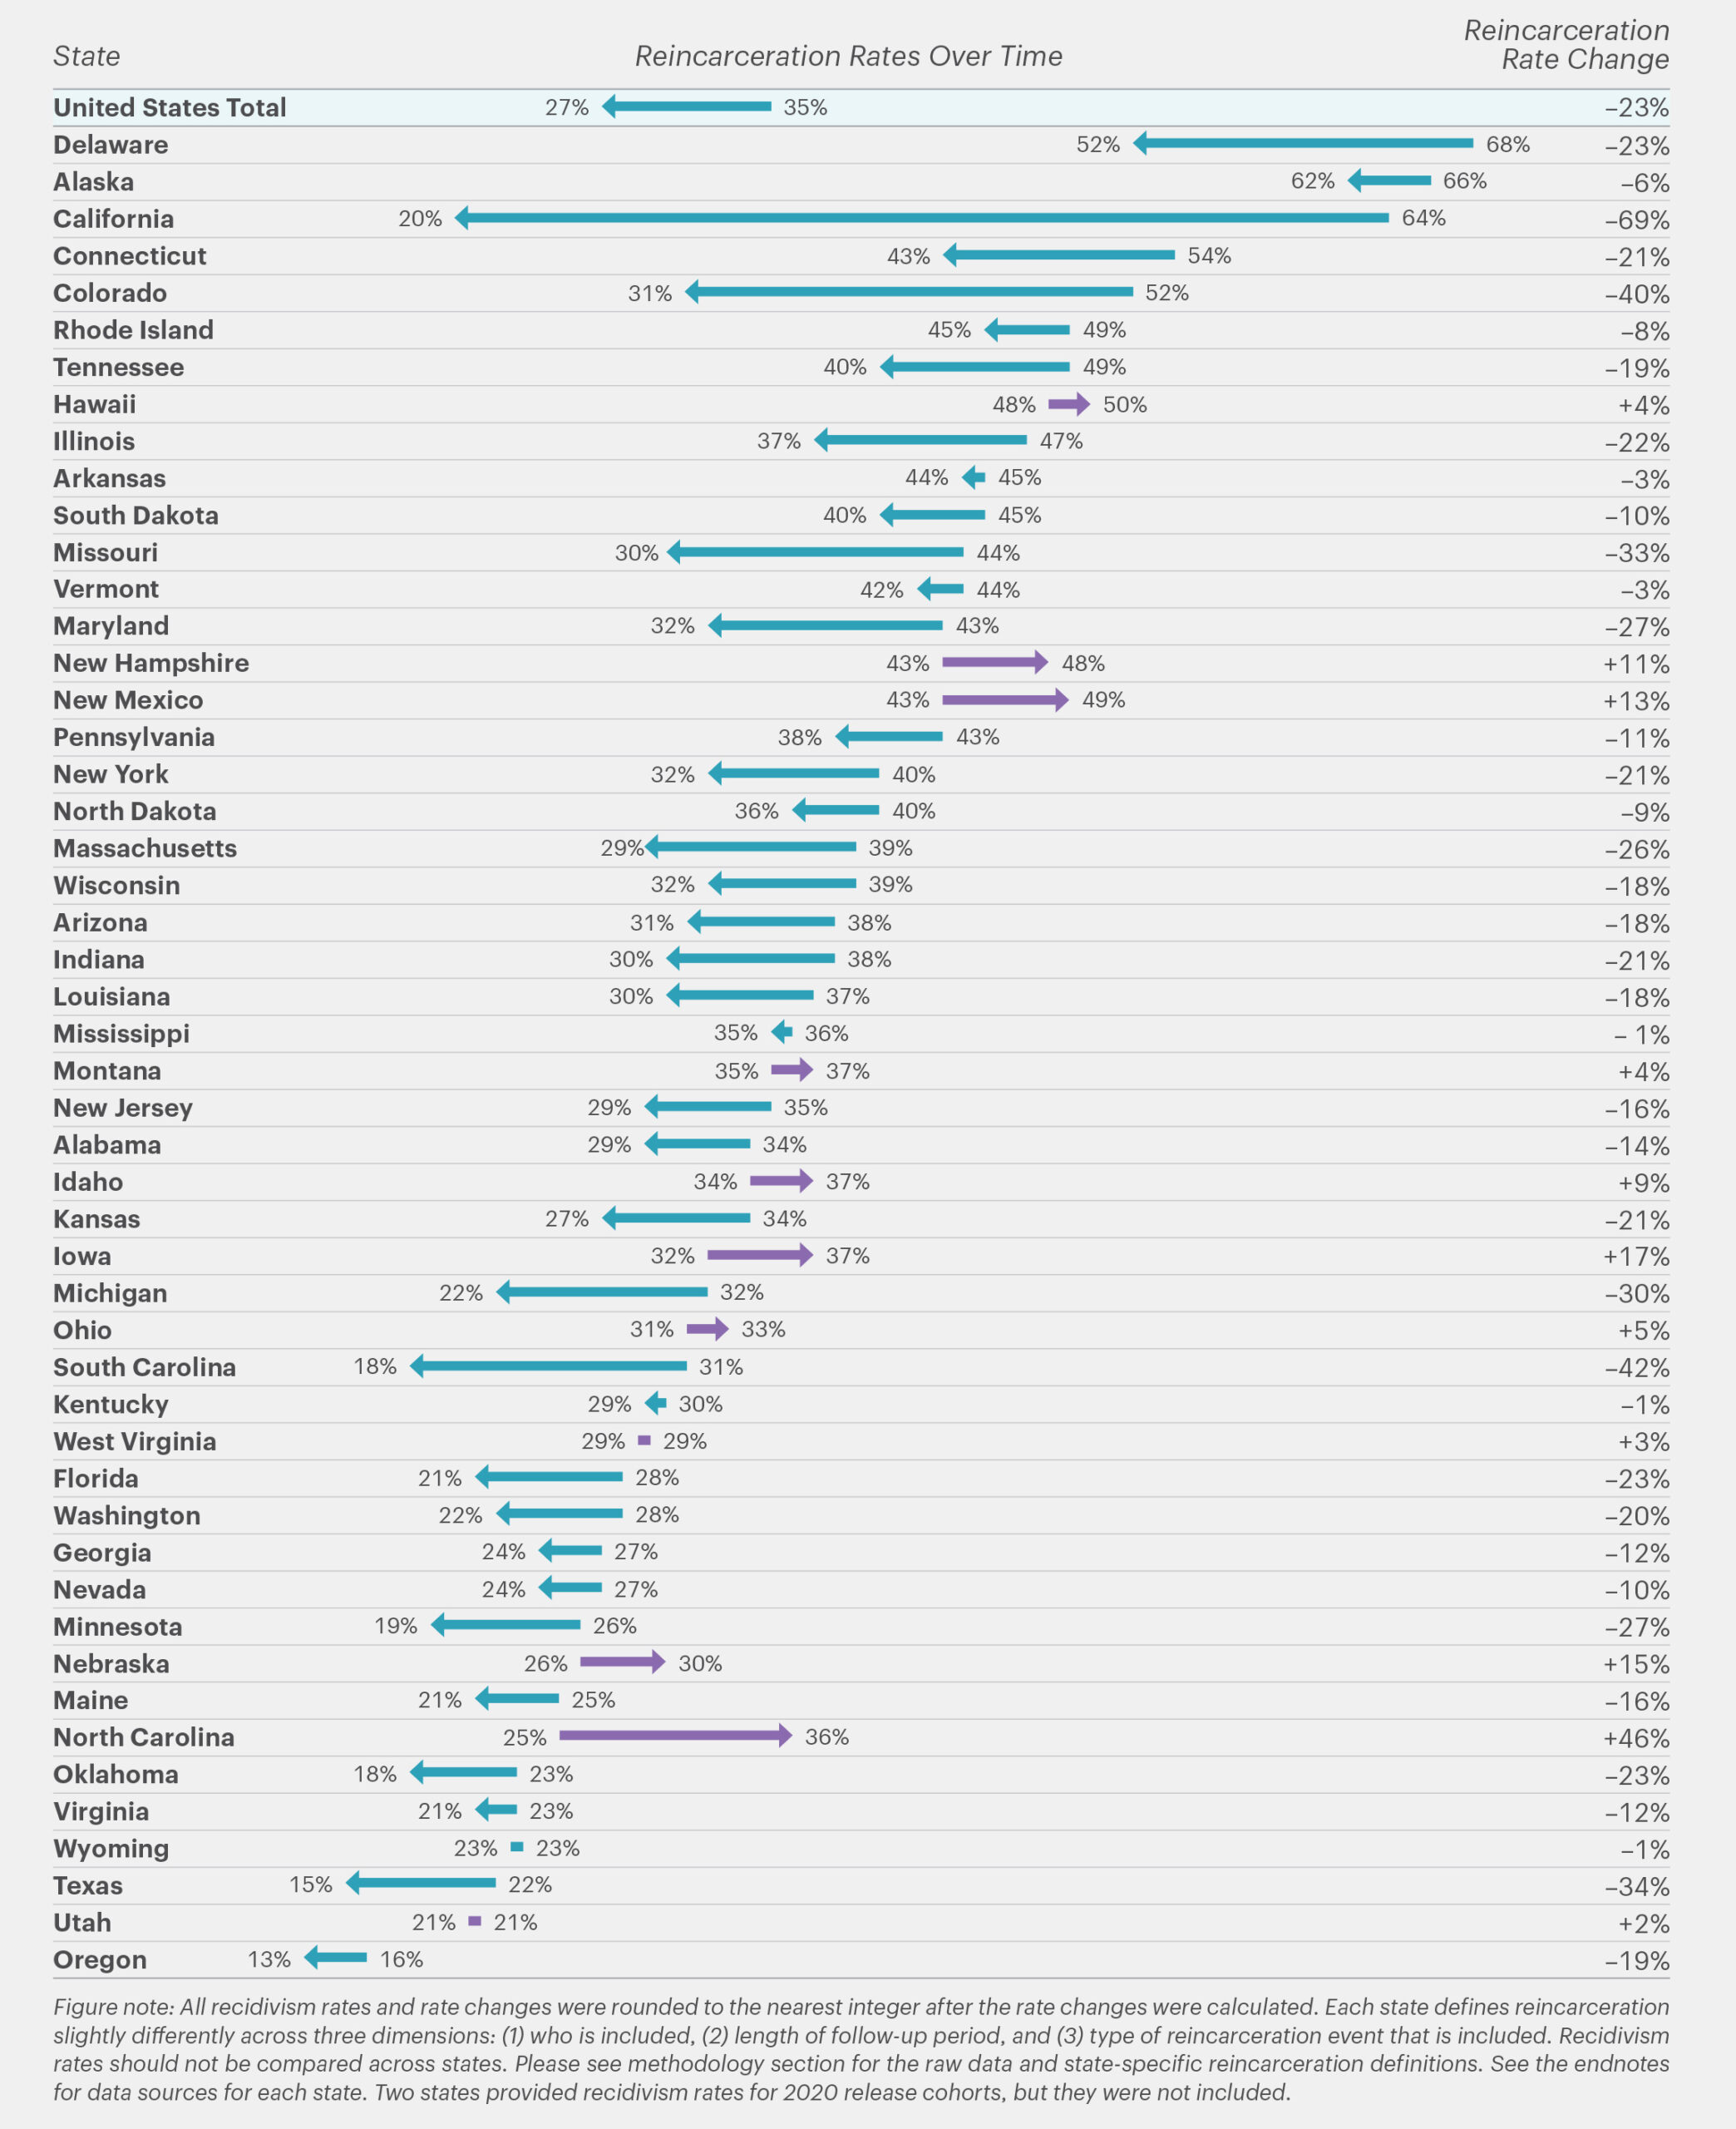
- Three-year reincarceration rates have decreased by 23 percent nationally since the passage of the Second Chance Act.
- Thirty-five percent of people exiting prison in 2008 were reincarcerated within 3 years, whereas 27 percent of people exiting prison in 2019 were reincarcerated within 3 years.
- If this lower rate of recidivism is sustained for people released in 2022, it would mean that 33,500 fewer people will be reincarcerated compared with the rate from 2008.3
Three-quarters of states experienced a reduction in reincarceration. Before the passage of the Second Chance Act, 11 states had 3-year reincarceration rates above 45 percent, compared to 6 states with similarly high reincarceration rates in the last few years. Recidivism rates dropped by double digits in 9 states: California, Colorado, Connecticut, Delaware, Illinois, Maryland, Massachusetts, Missouri, and South Carolina.
Impact of Sentencing Policy Changes on Recidivism
Recidivism rates reflect not just the behavior of people after reentry, but the correctional system’s response to their behavior. In two states that saw especially large changes in recidivism (and in opposite directions), it is important to note that changes to policies governing supervision changed the scope of who could be reincarcerated in state prison. These policy changes during the period under examination in this report considerably shifted the populations subject to reincarceration.
California saw a decrease of 44 percentage points in reincarceration (defined as return to prison) rates. This reduction coincided with the implementation of California Realignment (2011 AB 109), which shifted supervision following prison (for those serving nonserious and nonviolent felonies) from parole to probation and revocations from prison to jail.4
North Carolina experienced the largest increase in reincarceration rates, going from 25 percent to 36 percent between 2008 and 2019 release cohorts. Prior to 2011, unlike most states, 85 percent of people leaving prison in North Carolina were released unsupervised. State law changed in 2011 to require 9–12 months of supervision for all individuals leaving prison, expanding the post-release supervision population subject to reincarceration for violations.5
Change in Recidivism Since the 2008 Second Chance Act
Reincarceration rates between the earliest to the latest release cohorts
Current Cost of Recidivism
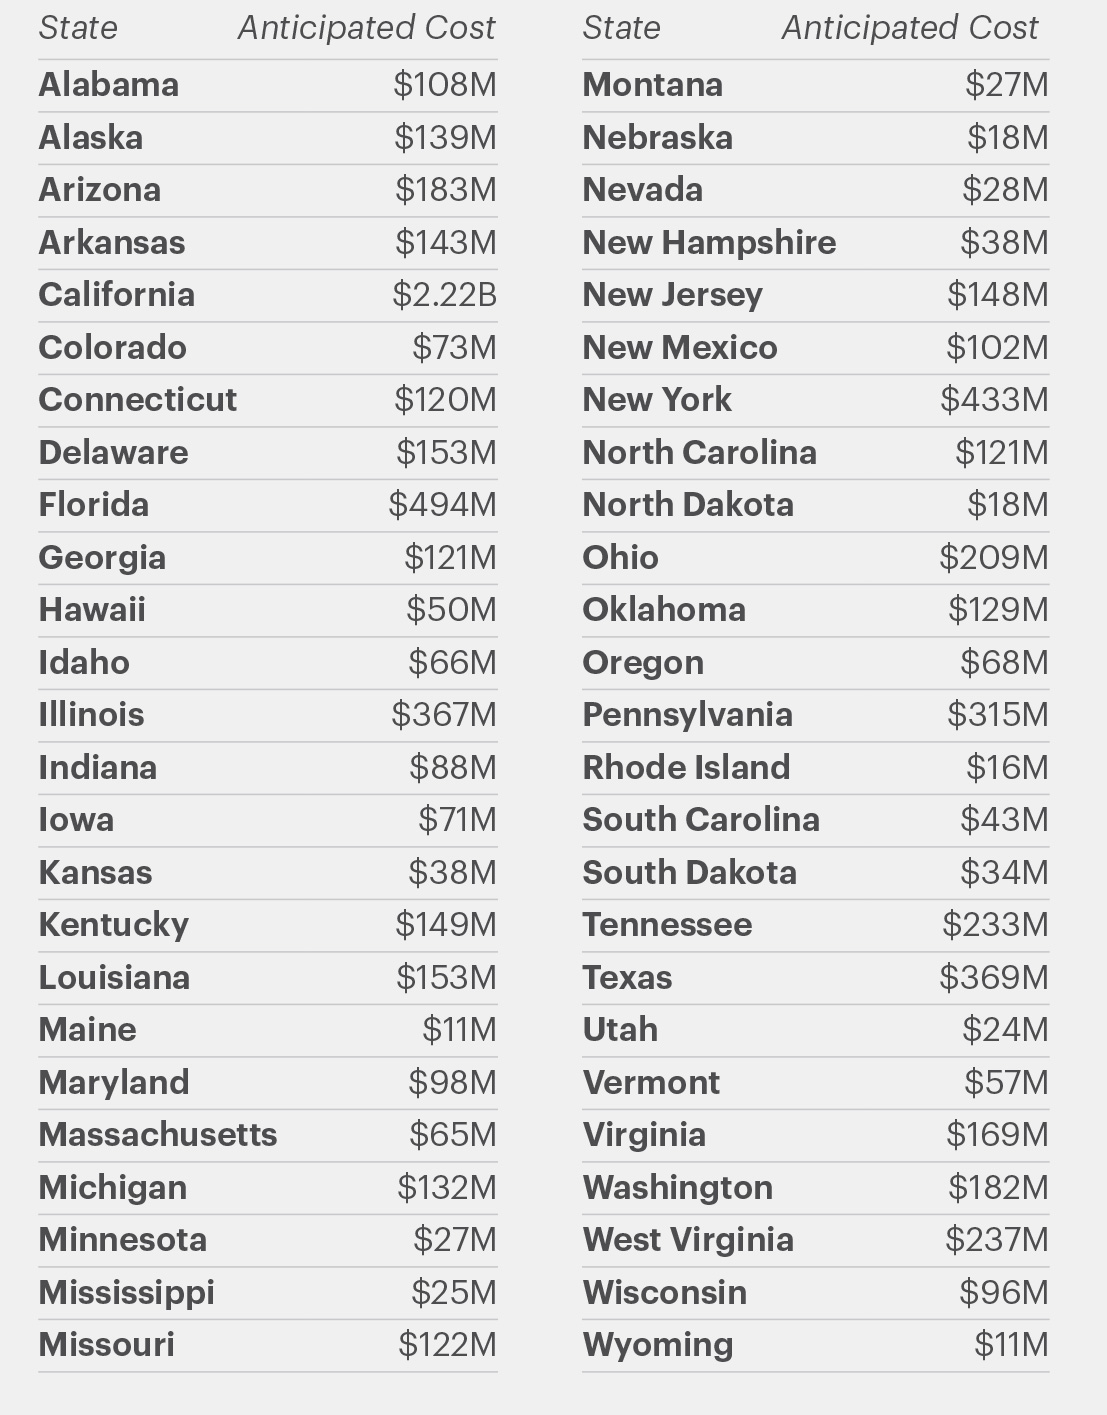
While states have made tremendous progress in reducing recidivism with the support of the Second Chance Act, they are still paying a hefty price. States will collectively spend an estimated $8 billion to reincarcerate people who were released from prison in 2022. To avert these costs by reducing recidivism further, state and local governments, as well as nonprofit organizations, need expanded support to ensure that the individuals returning from prison, jail, and juvenile facilities each year continue to receive coordinated, evidence-based reentry services that will increase public safety.
Anticipated Cost of Reincarceration for 2022 Prison Release Cohort by State6
State Leaders Are Adopting Bold Goals to Scale Reentry Success
Second Chance Act funding is ongoing and supports bold new ways to improve reentry, like the innovative Reentry 2030 initiative. Reentry 2030 is a national effort to achieve better and more equitable reentry and reintegration outcomes.7 Reentry 2030 launched in 2023 with an invitation to states to adopt public, ambitious goals that drive system change and a promise of support to reach these goals. Four states are leading the way to safer and stronger communities by developing bold goals to support successful reintegration for every person with a criminal record, with more states to come.
Missouri
The first state to sign on to Reentry 2030, Missouri is working with public and private partners to support people who are incarcerated in finding and maintaining employment upon release. Their bold goals include the following:
- 100 percent of people who are incarcerated and need career services receive them.
- 85 percent of people who are incarcerated are employed within 30 days of release.
- 80 percent of formerly incarcerated people maintain their employment for at least 9 months after release.

“We are proud to be the first state to sign on to this important initiative that unites government agencies around a common reentry goal,” Governor Mike Parson said. “Workforce development has been a top priority of our administration since day one, and by working together, we will get people back into the workforce so they can support their families, contribute to Missouri’s economy, and help make our communities safer and stronger.”
Alabama
Through Reentry 2030, Alabama, the second state to join the initiative, strives to build on successes to date by boldly committing to the following goals:
- Cut the state’s 29 percent recidivism rate in half.
- Increase employment services by 50 percent by 2030.
Alabama has invested more than $100 million to support successful reentry since 2016. The state has been committed to a coordinated reentry effort since 2021, when the Alabama Legislature created the Commission on Reentry, which connects policymakers and leaders from the state departments of corrections, community supervision, law enforcement, prosecution, mental health, Medicaid, human resources, veterans’ affairs, and more to collaboratively develop recommendations and strategies to improve reentry outcomes.

“In Alabama, we believe in second chances, and we are determined to make them count. Together, with an all-hands-on-deck approach, we are eager to utilize the resources and support through the Reentry 2030 initiative and to share our progress and ideas to increase collaboration, reentry success, and public safety. We are not just transforming lives; we are shaping a brighter future for Alabama,” said Cam Ward, director of the Alabama Bureau of Pardons and Paroles.
North Carolina
Governor Roy Cooper issued Executive Order No. 303 directing a whole-of-government approach to improve reentry for formerly incarcerated people and achieve bold goals, including the following:
- Increase the number of high school and postsecondary credentials earned by people who are incarcerated by 75 percent.
- Reduce the number of individuals who are released to homelessness by 50 percent.
- Increase the number of postsecondary degrees offered in facilities by 25 percent.
- Increase the number of Pell Grant partners by 30 percent.
- Ensure all eligible individuals who are incarcerated are offered the opportunity to apply for Medicaid before release.

“Every person deserves the opportunity to live a life of joy, success, and love even when we make mistakes. Every single one of us can be redeemed,” Governor Cooper said.
Nebraska
Nebraska, under the leadership of Governor Jim Pillen and Department of Corrections Director Rob Jeffreys, is committed to improving reentry outcomes by 2030. Governor Pillen issued a proclamation that stated, “Every person is endowed with human dignity and value; and… redemption and second chances are American values.”
The fourth state to join Reentry 2030, Nebraska is creating a statewide reentry council composed of public, private, and service provider entities to develop a systemic approach to reentry. Nebraska’s goals demonstrate the state’s commitment to exploring collaborative and systemic solutions, equipping individuals who are incarcerated with the education and resources they need for reentry success, and building stronger families and communities. These goals include the following:
- Reduce recidivism by 46 percent.
- Promote education, including a 30 percent increase in GED completion during incarceration.
- Ensure all eligible individuals are enrolled in Medicaid prior to reentry.
- Provide support so that at least 90 percent of individuals will be gainfully employed within 30 days of parole placement.

Enormous strides have been made with the support of the Second Chance Act—and there is more to be achieved. State leaders are motivated to scale up their success, build on their momentum to improve reentry outcomes, and reduce recidivism further. Our progress to date should inspire us to take successful reentry strategies to scale. Now is the time to continue investing in what works, reducing prison costs, and making communities safer. When states do reentry right, they reduce racial disparities in incarceration, ease pressures on prison staffing, and reduce crime.
State-by-State Recidivism Rates and Methodology Notes
The CSG Justice Center collected state-level recidivism data by looking for recidivism rates over the last 15 years in published state reports. The most commonly reported recidivism metric was reincarceration within 3 years of release from prison (by release cohort); however, not all states publish this information. Similarly, not all states reported recidivism rates in 2008 and 2019 (the most recent year likely to be feasible to report on a 3-year observation window). When the information was not publicly available, members of the CSG Justice Center Research Division recorded the recidivism rates for cohorts exiting prison in the years that were closest to 2008 and 2019. Finally, they reached out to state officials to obtain recidivism rates when none were available. Additional information on the source of each recidivism data point is available below.
States calculate recidivism rates differently across: (1) who is included in the analysis, (2) what the state considers a “recidivism event,” and (3) the length of time after release that is monitored. Therefore, state recidivism rates should never be compared across states directly, even if the state definition in the table below is the same.
State-by-State Sources for Recidivism Data
Endnotes
1. Information provided by the Bureau of Justice Assistance and by the Office of Juvenile Justice and Delinquency Prevention.
2. Matthew Durose and Leonardo Antenangeli, Recidivism of Prisoners Released in 34 States in 2012: A 5-Year Follow-Up Period (2012–2017) (Washington, DC: Bureau of Justice Statistics, 2021), https://bjs.ojp.gov/library/publications/recidivism-prisoners-released-34-states-2012-5-year-follow-period-2012-2017.
3. Total number of recidivism events avoided was calculated by adding the number of people who will be reincarcerated using the earliest .5 rate compared to how many people will be reincarcerated using the most recent reincarceration rate based on the number of people released from prison by each state in 2022 according to the National Prisoner Statistics Program (https://bjs.ojp.gov/data-collection/national-prisoner-statistics-nps-program).
4. Magnus Loftstrom and Brandon Martin, Public Safety Realignment: Impacts So Far (San Francisco, CA: Public Policy Institute of California, 2015), https://www.ppic.org/publication/public-safety-realignment-impacts-so-far/.
5. North Carolina Sentencing and Policy Advisory Commission, Quick Facts: Adult Recidivism (Raleigh, NC: NC Sentencing and Policy Advisory Commission, 2022), https://www.nccourts.gov/assets/documents/publications/SPAC-2022-Adult-Recidivism-Quick-Facts-FY-2019.pdf?VersionId=pAYvtWTlVjANIKnqiPvQDGiqUjh1D.pl; For all reports, see “Previous Adult Recidivism/Correctional Program Evaluation,” North Carolina Judicial Branch, last modified October 9, 2023, https://www.nccourts.gov/documents/publications/previous-adult-recidivismcorrectional-program-evaluation.
6. Cost of 2022 recidivism cohort was calculated by multiplying the number of people released from prison reported in the 2022 from the National Prisoner Statistics Program (https://bjs.ojp.gov/data-collection/national-prisoner-statistics-nps-program) by the most recent recidivism rate to estimate the number of people who will be reincarcerated within 3 years of release. An average length of stay for prison stays where the admission was for a parole violation or revocation was calculated using the National Corrections Reporting Program (https://bjs.ojp.gov/data-collection/national-corrections-reporting-program-ncrp). The estimated number of people who will be reincarcerated was multiplied by the average length of stay, and then multiplied that by the average cost of incarceration provided to The Council of State Governments Justice Center (https://projects.csgjusticecenter.org/supervision-violations-impact-on-incarceration). When data on length of stay was missing for a state, the cross-state average was used. Average daily costs included fixed and variable expenses such as maintenance, staffing, food, supplies, and health care services. It’s important to note that reductions in prison populations and recidivism may not necessarily translate into immediate savings or reinvestment opportunities due to fixed expenditures such as capital assets and staffing costs, which take time to adjust. However, over time, long-term expenditures related to staffing and decisions to close unnecessary units can increase the amount of savings for each state.
7. Reentry 2030 is anchored by support from the U.S. Department of Justice’s Office of Justice Programs’ Bureau of Justice Assistance under the Second Chance Act and Arnold Ventures, with Microsoft, the Tow Foundation, and others providing additional funding. Learn more at https://reentry2030.org/.
Project Credits
Writing: Marshall Clement, Susan Gottesfeld, Christopher Horn, Catherine Moga Bryant, Jessica Saunders, CSG Justice Center
Research: Jessica Saunders, CSG Justice Center
Editing: Alice Oh, CSG Justice Center
Design: Michael Bierman
Web Development: Nick Gehring, eleventy marketing group
Public Affairs: Christopher Horn, CSG Justice Center

This project was supported by 15PBJA-23-GK-05503-MUMU awarded by the Bureau of Justice Assistance. The Bureau of Justice Assistance is a component of the Office of Justice Programs, which also includes the Bureau of Justice Statistics, the National Institute of Justice, the Office of Juvenile Justice and Delinquency Prevention, the Office for Victims of Crime, and Office of Sex Offender Sentencing, Monitoring, Apprehending, Registering, and Tracking. Points of view or opinions in this document are those of the author and do not necessarily represent the official position or policies of the U.S. Department of Justice.
On June 26, the CSG Justice Center convened state leaders in workforce development, education, and corrections from 7…
Read More
While corrections agencies across the country collect vast amounts of data and make significant investments in…
Read More
19 states were recently granted permission by CMS to reimburse critical reentry services with Medicaid funding for up…
Read MoreOn June 26, the CSG Justice Center convened state leaders in workforce…
Read More
A “Once in a Generation Opportunity” to Improve Reentry for Nearly 2 Million People
19 states were recently granted permission by CMS to reimburse critical reentry…
Read More First-of-its-Kind Plan for States to Support Children and Families with Incarcerated Parents
Our plan—developed with the National Resource Center on Children & Families of…
Read More Breaking the Cycle of Homelessness and Incarceration: Q&A with New CSG Justice Center Advisory Board Member Wayne Niederhauser
The CSG Justice Center Advisory Board establishes the policy and project priorities…
Read More Involuntary Treatment for Patients in the Justice System: Q&A with Dr. Marvin Swartz
"AOT is a complex community intervention that can be effective or not…
Read More