


50 States, 1 Goal: Recidivism Rate Trends Over the Past Decade

Photo Credit: Hédi Benyounes/Unsplash
Updated May 12, 2026
States spend roughly $80 billion annually on corrections. Understanding how many people released from prison return within 3 years is one important way to assess whether that investment is working and where the system is falling short. Yet comprehensive 50-state recidivism data has long been severely limited.
In 2024, the CSG Justice Center compiled publicly available state-by-state recidivism data covering release cohorts from 2008 through 2018–2019 (where available). Since then, 40 states have published more recent recidivism data on people released, giving us a more current picture of state-level recidivism trends. However, 11 states have not published recidivism data for cohorts released after 2019, making this data stale even in the states where it was just released. In 4 of those states (Hawaii, Ohio, Pennsylvania, and West Virginia), the most recent available data is for people released in 2016.
This brief highlights key findings based on the latest available data and reexamines whether recidivism rates have changed meaningfully over the past decade.
1. Most people released from prison do not return.
Nearly 75% of people released from prison now avoid reincarceration within 3 years—the critical window when recidivism is most likely to occur.
Nationally, reincarceration rates have dropped about 20% over the past decade, from approximately 35% to 28%. As a result, 72 out of every 100 people released today do not return to prison within 3 years, compared with 65 a decade ago—about 30,000 fewer people returning to prison each year.
In Texas alone, nearly 50,000 of the 58,670 people released in 2021 did not return to prison within 3 years. In 9 states (Oregon, Texas, California, Oklahoma, Virginia, Utah, New York, South Carolina, and Minnesota), 1 in 5 or fewer people released were reincarcerated within 3 years.
2. Progress to reduce recidivism is real but uneven, and gaps remain.
Eight states recorded a 30% or greater reduction in reincarceration rates over the past 10 years (California, New York, New Jersey, Colorado, Massachusetts, Michigan, Oregon, and Missouri), demonstrating that meaningful progress is possible across diverse policy environments.
But a handful of states (including North Carolina, Pennsylvania, and South Dakota) recorded higher reincarceration rates than they did 10 years ago.
And for 10 states, the most recent recidivism data available is outdated—ending with release cohorts from 2016, 2018, or 2019—limiting accountability and our ability to assess whether progress is holding:
- 2016: Hawaii, Ohio, Pennsylvania, West Virginia
- 2018: Alabama
- 2019: Arkansas, Illinois, Maryland, Montana, Oklahoma
3. State recidivism trends demand state-level attention.
Whether recidivism rates are rising or falling, policymakers need to understand what’s driving their numbers and act on what they find.
Changes in reincarceration rates reflect many factors: changes in who is incarcerated, how people are supervised after release, changes in technical violation policies, and what reentry opportunities exist. No two states are the same, and national trends can obscure important variation. That’s why this analysis examines trends within states over time rather than ranking or comparing states to one another.
States also define recidivism differently, varying the follow-up period (two or three years), the outcome measured (rearrest, reconviction, or reincarceration), and the population included. All state-specific definitions are documented in the appendix below.
State-by-State Recidivism Rates Over the Past Decade
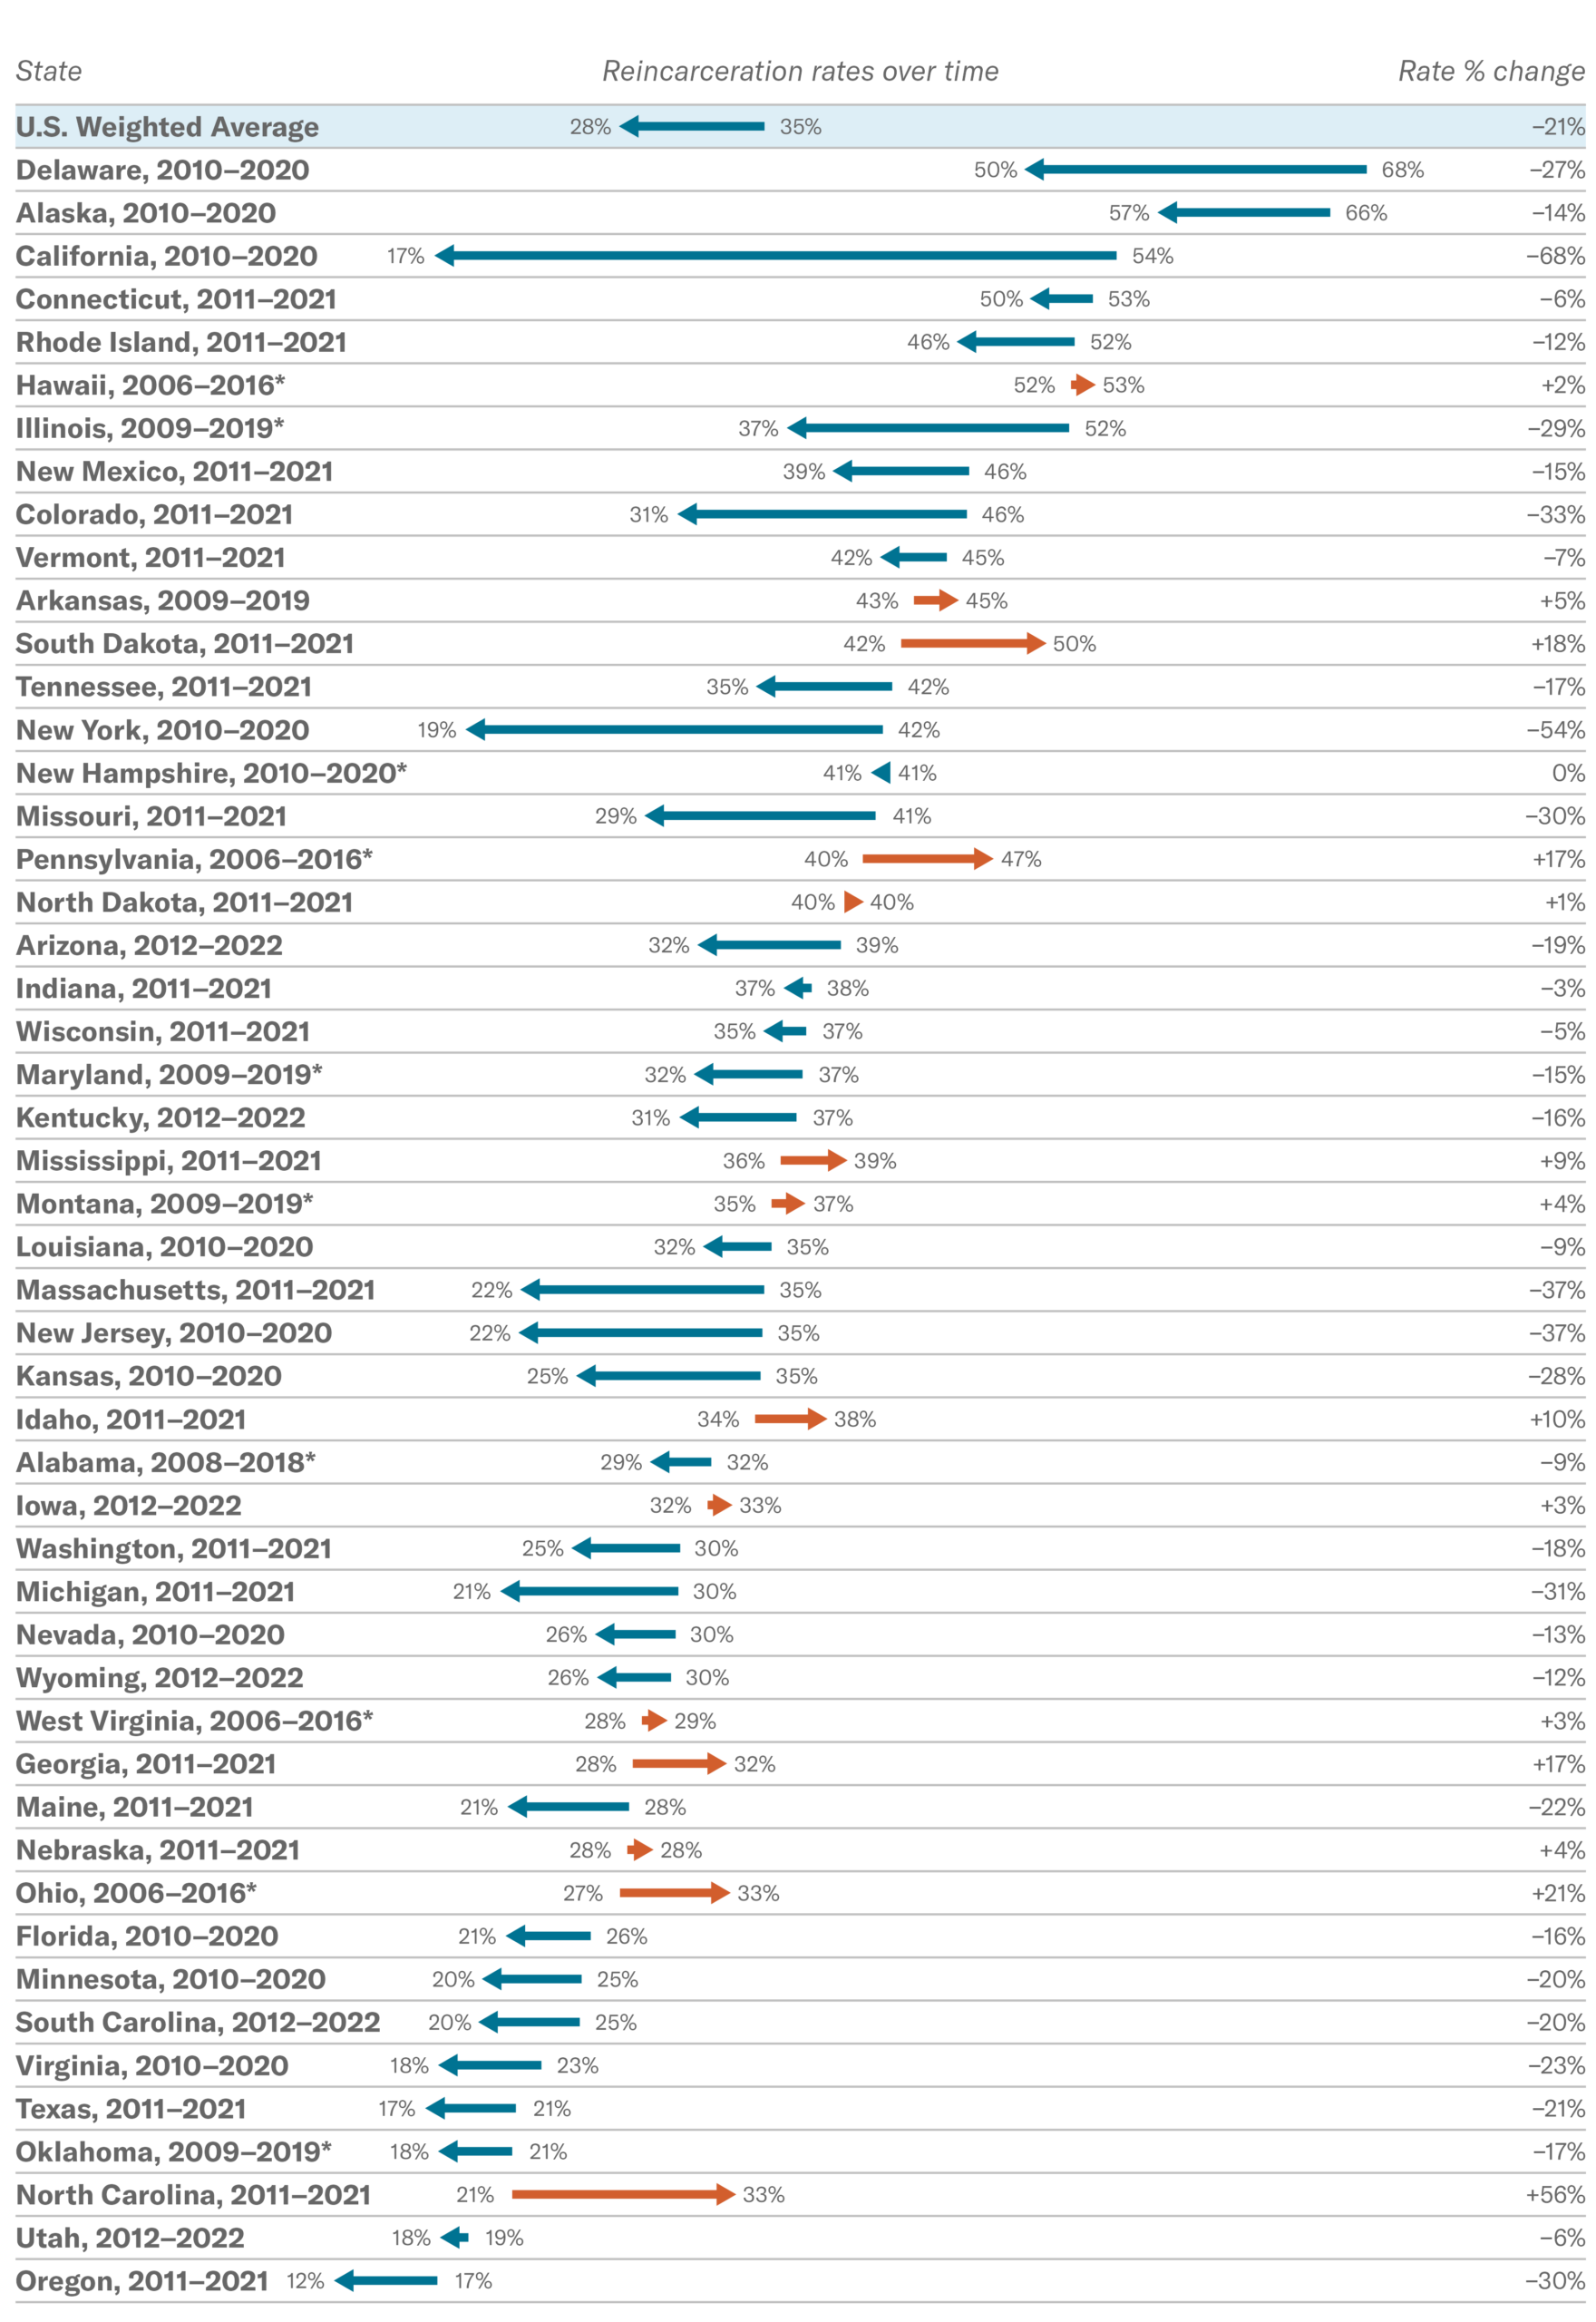
*States that have not published new recidivism data since the previous report; the year of the most recent data available for these states is included in the chart.
Interested in building on this progress in your state? Learn about Reentry 2030 and how it can support your reentry efforts.
Appendix
Recidivism Measures
CSG Justice Center staff collected state-level recidivism data by reviewing each state department of corrections (DOC) website. Data were drawn from publicly available dashboards, annual reports, and special recidivism reports. In some states, analyses were produced by the DOC; in others, they were conducted by external researchers or other government agencies.
There is no single standardized definition of recidivism across states. Definitions vary by (1) the population included in the analysis, (2) the follow-up period, and (3) the event counted as recidivism. Many states report multiple measures.
The most common approach, used by 36 states, follows an annual prison release cohort (all individuals released from state prison in a given year) for 3 years after release and defines recidivism as reincarceration in state prison for any reason during that period. Because this measure was the most widely available, we used it as our primary definition. When a state did not report this measure, we selected the metric that most closely aligned with it. Some states vary in the populations included; the follow-up period (for example, two years rather than three); or the event measured, such as rearrest, reconviction, or reincarceration for a new crime only. All state-specific definitions and deviations are documented in the appendix table below. Because states report data for different release cohorts and years, results reflect the most recent data available for each state rather than a single uniform cohort across states. To estimate national trends, we calculated weighted national average recidivism rates for 2 time points: each state’s most recent reported rate and the rate reported approximately 10 years earlier. State rates were weighted by the size of the corresponding prison release cohort used to calculate the recidivism measure.
Limitations
Differences in how states define and measure recidivism limit the precision of cross-state comparisons. Despite these variations, the data provide a useful indicator of overall recidivism trends across states.
State | Most Recent Exit Cohort Available | Recidivism Rate | Definition |
|---|---|---|---|
| Alabama | 2018 | 29% | Primary definition |
| Alaska | 2020 | 57% | Includes jail population |
| Arizona | 2022 | 32% | Primary definition |
| Arkansas | 2019 | 45% | Primary definition |
| California | 2020 | 17% | Primary definition |
| Colorado | 2021 | 31% | Primary definition |
| Connecticut | 2021 | 50% | Includes jail population |
| Delaware | 2020 | 50% | Primary definition |
| Florida | 2020 | 21% | Primary definition |
| Georgia | 2021 | 32% | Only includes felony reconviction |
| Hawaii | 2016 | 53% | Only includes arrest or reconviction |
| Idaho | 2021 | 38% | Includes supervision populations and both reincarceration and return to supervision |
| Illinois | 2019 | 37% | Primary definition |
| Indiana | 2021 | 37% | Primary definition |
| Iowa | 2022 | 33% | Primary definition |
| Kansas | 2020 | 25% | Primary definition |
| Kentucky | 2022 | 31% | 2-year follow-up only |
| Louisiana | 2020 | 32% | Primary definition |
| Maine | 2021 | 21% | Primary definition |
| Maryland | 2019 | 32% | Includes reincarceration in federal prison |
| Massachusetts | 2021 | 22% | Primary definition |
| Michigan | 2021 | 21% | Primary definition |
| Minnesota | 2020 | 20% | Only includes reconviction |
| Mississippi | 2021 | 39% | Primary definition |
| Missouri | 2021 | 29% | Primary definition |
| Montana | 2019 | 37% | Primary definition |
| Nebraska | 2021 | 28% | Primary definition |
| Nevada | 2020 | 26% | Primary definition |
| New Hampshire | 2020 | 41% | Primary definition |
| New Jersey | 2020 | 22% | Primary definition |
| New Mexico | 2021 | 39% | Primary definition |
| New York | 2020 | 19% | Primary definition |
| North Carolina | 2021 | 33% | 2-year follow-up only |
| North Dakota | 2021 | 40% | Primary definition |
| Ohio | 2016 | 33% | Primary definition |
| Oklahoma | 2019 | 18% | Primary definition |
| Oregon | 2021 | 12% | Includes reincarceration for a new felony |
| Pennsylvania | 2016 | 47% | Includes reincarceration or new arrest |
| Rhode Island | 2021 | 46% | Primary definition |
| South Carolina | 2022 | 20% | Primary definition |
| South Dakota | 2021 | 50% | Primary definition |
| Tennessee | 2021 | 35% | Includes reincarceration in a prison or a jail |
| Texas | 2021 | 17% | Primary definition |
| Utah | 2022 | 18% | Only includes reincarceration for a new crime |
| Vermont | 2021 | 42% | Only includes reincarceration for over 90 days |
| Virginia | 2020 | 18% | Primary definition |
| Washington | 2021 | 25% | Primary definition |
| West Virginia | 2016 | 29% | Primary definition |
| Wisconsin | 2021 | 35% | Primary definition |
| Wyoming | 2022 | 26% | Primary definition |
Project Credits
Writing: Jessica Saunders, CSG Justice Center
Research: Jessica Saunders, Rebecca Cohen, and Chelsey Wright, CSG Justice Center
Advising: Marshall Clement, Susan Gottesfeld, CSG Justice Center
Editing: Leslie Griffin, CSG Justice Center
Web Development: Caroline Cournoyer, CSG Justice Center
Public Affairs: Sarah Kelley, CSG Justice Center