Infographic: States Juvenile Incarceration Rates Dropping
This infographic uses data from the Office of Juvenile Justice and Delinquency Prevention to show state-by-state changes in the juvenile incarceration rate between 1997 and 2013.
A positive school experience, where a child feels secure, is essential for their well-being. However, for many children…
Read More The Path to Statewide Community Crisis Response in New Jersey: A Community Advocate’s Perspective
Read More
 Supporting Children of Incarcerated Parents: Reimagining School and Community Collaboration
A positive school experience, where a child feels secure, is essential for their well-being. However, for many children with incarcerated parents—one in 14 in the U.S.—school can feel far from safe due to stigma, trauma, and a lack of understanding.
Read More Bridging Communities and Correctional Systems: Q&A with CSG Justice Center Advisory Board Member Commissioner Nicholas Deml
Read More
 Assigned to the Cloud Crew: The National Incarceration Association’s Hybrid Case Management for People with Behavioral Health Needs
When returning to their communities from criminal justice settings, people with behavioral health needs face barriers in accessing basic needs—including food, housing, employment, transportation, education, clothing, and substance use and mental health services—which increases their risk of experiencing a crisis.
Read More Meet the Medicaid and Corrections Policy Academy Mentor States
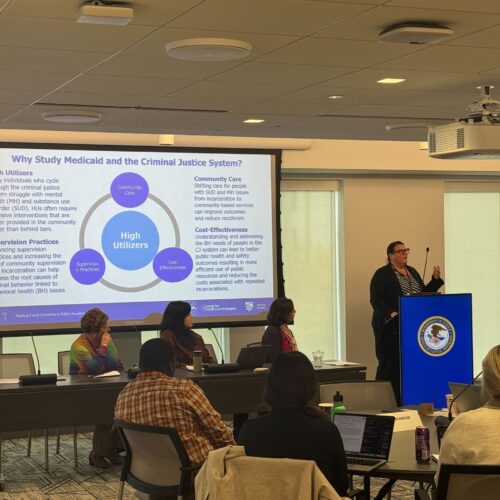
New Hampshire Department of Corrections Commissioner Helen Hanks presents at the Medicaid and Corrections Policy Academy in-person meeting.
Read More


